Visualize the Force That Moves Speakers
Analog CRT Oscilloscope Simulator
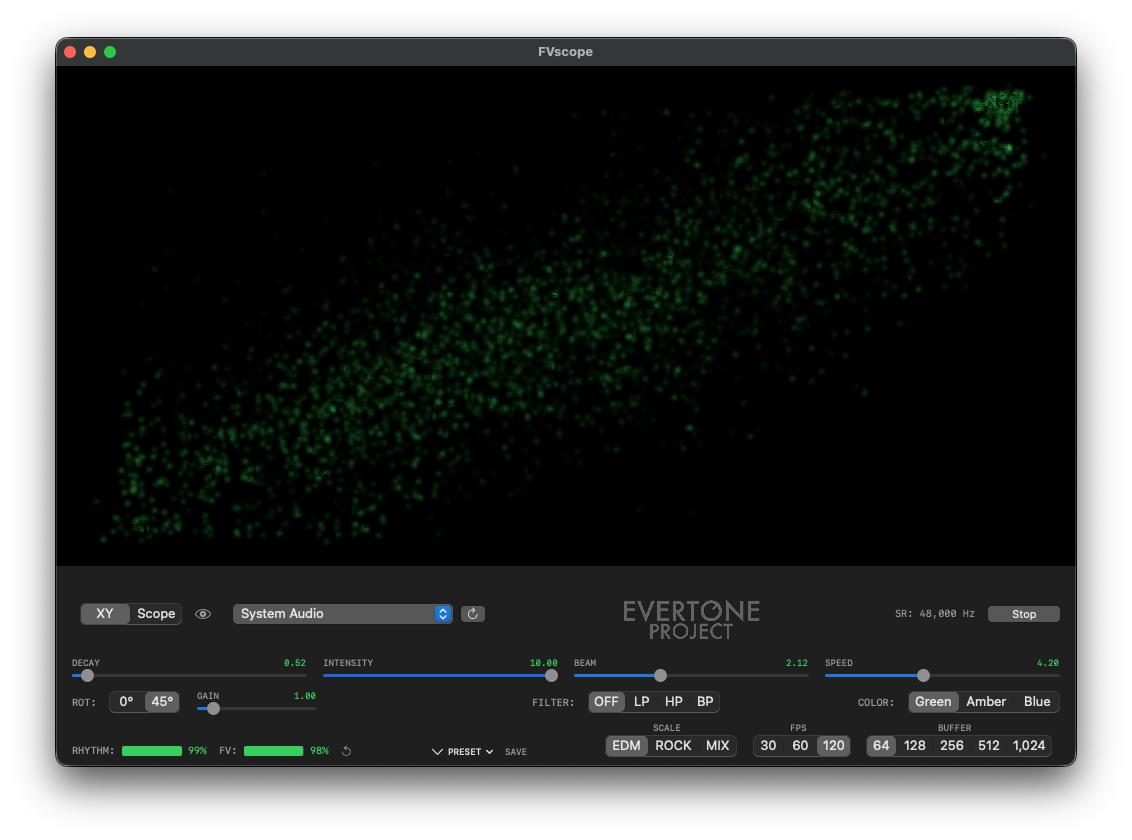
XY Mode — Lissajous Display
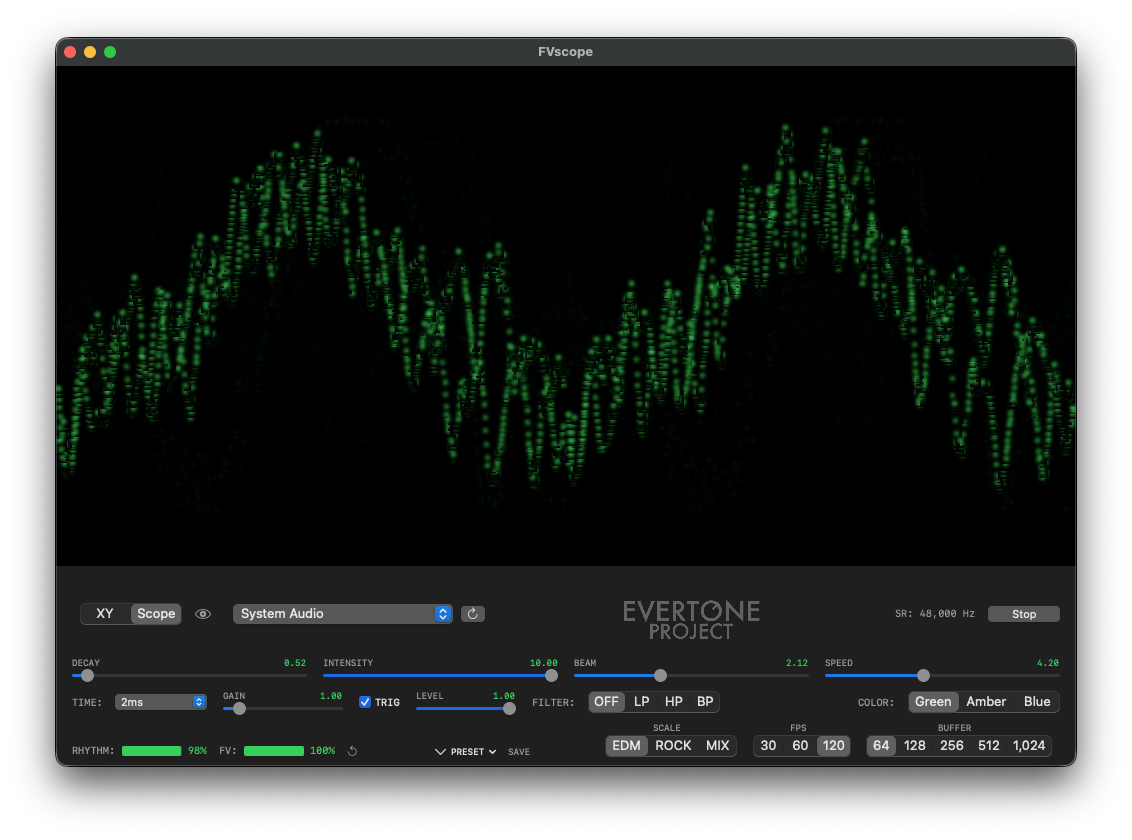
Scope Mode — Waveform Display
When music is played back, the speaker cone (diaphragm) moves back and forth, vibrating the air. The acceleration component of this cone movement — how vigorously it accelerates — cannot be read from conventional meters such as RMS, peak, LUFS, or crest factor.
A signal that presses firmly against the speaker cone transmits force continuously, accelerating the cone vigorously. In contrast, a signal that strikes from a distance transmits force only momentarily, resulting in gentler cone movement. Even at the same loudness, this difference in how force is transmitted determines the "punch" and "presence" of the sound coming from the speaker.
In music production, it has long been common practice to apply aggressive maximization, pushing waveforms to their limits to achieve what is perceived as "loudness" on playback devices. However, even among tracks with similarly hard-maximized, flat waveforms, there are clear differences in perceived power and presence, and opinions on quality have always been divided.
Where does this difference come from? When we separate the concepts of "sound pressure" at the electrical signal or data level from "loudness" at the playback device, what emerges is not a matter of playback environment or equipment performance, but the existence of "pressure" inherent in the source itself. To use a wind analogy: increasing airflow volume to generate pressure versus compressing air with a compressor and blasting it out — both create "pressure," but the way it is generated is entirely different. FVscope was born from an attempt to visualize this component that conventional meters have never quantified.
FV (Force Voltage) is FVscope's proprietary metric for evaluating this acceleration component. Even among tracks at the same loudness level, FV values can differ significantly.
Striking from a distance —
force is transmitted momentarily
Pressing firmly and pushing —
force is transmitted continuously
Low FV does not mean bad. EDM sidechain compression, smooth ambient pads, delicate film score strings — the appropriate dynamics vary by genre and artistic intent. FVscope is not a tool that judges "good" or "bad," but a monitoring tool that objectively visualizes signal characteristics.
FVscope's applications extend beyond source analysis. Try playing a track with high FV values while comparing the actual sound from your speakers with the beam movement on the scope. If the "energy" indicated by the signal matches what you hear, the speaker is faithfully reproducing the acceleration components. Conversely, if the scope shows sharp movements but the sound feels dull, there may be room for improvement in your playback environment.
By understanding speaker behavior and playback capability from a perspective different from frequency response, you can approach areas that have been difficult to explore with conventional measurement tools — such as speaker tuning, room acoustics adjustment, and speaker selection.
Lissajous display of L/R channels. Simulates analog CRT oscilloscope phosphor, allowing intuitive visualization of acceleration component contrast through beam velocity-dependent brightness.
Independent L/R waveform display. Edge-triggered for stable waveform visualization. CRT phosphor simulation reveals velocity changes in the waveform visually.
Quantifies the acceleration component in signals in real time. Displays evaluation across three scales — EDM / ROCK / MIX — tailored to different genres.
Detects periodicity from the input signal's envelope. Evaluates the clarity of rhythm patterns in real time.
Evaluates the acceleration component contained in the signal. Quantifies the force that moves speakers from transients and envelope curves.
Evaluates the periodicity of the input signal's envelope curve.
The RHYTHM and FV meters display smoothed values based on continuous analysis of the signal over the last several seconds. For comparisons, allow at least 10 seconds of playback and use the displayed percentage as a guide. When switching tracks, use the reset button (↺) to clear the values before playback for more accurate comparisons.
For electronic dance music. Displays raw values as-is.
For rock and pop music. Expands the mid-range display for genre-appropriate evaluation.
Single instrument mode. Adds envelope shape analysis, displaying on a scale suited for evaluating individual tracks and instruments.
FVscope simulates the phosphor of an analog CRT oscilloscope.
The beam appears brighter when slow, darker when fast. In signals rich in acceleration components, the beam races through sharp attacks (dark) and pauses momentarily at peaks (bright). This contrast between light and dark indicates the presence of acceleration components.
Increasing the SPEED parameter makes this contrast more pronounced.
| DECAY | Phosphor persistence time |
| INTENSITY | Beam brightness |
| BEAM | Beam width |
| SPEED | Brightness sensitivity to velocity |
| GAIN | Signal display magnification (shared by XY / Scope) |
| COLOR | Green / Amber / Blue |
No special setup required. FVscope captures system audio directly. You can analyze playback from any application — Spotify, Apple Music, web browsers, and more.
Route audio through a virtual audio device.
1. Install BlackHole 2ch
2. Create a "Multi-Output Device" in macOS Audio MIDI Setup
3. Set the system/DAW output to "Multi-Output Device"
4. Select "BlackHole 2ch" as FVscope's input
Other options include Loopback (Rogue Amoeba), Pro Tools AUX out (version-dependent), and physical loopback via audio interface.
| Supported OS | macOS 12.3 or later (system audio requires 13.0+) / Windows 10 or later |
| Hardware | Apple Silicon / Intel Mac / Windows PC |
| Rendering | Metal (up to 120fps) |
| Sample Rate | 44.1 / 48 / 88.2 / 96 / 192 kHz |
| Display Modes | XY (Lissajous) / Scope (Waveform) |
| Price | Free |
Version 1.3.0
User Manual (PDF)macOS 12.3+ / Windows 10+
macOS: Signed with Developer ID · Apple Notarized
FVscope is provided free of charge. Use of this application is entirely at the user's own risk. The developer assumes no liability for any damages arising from its use.
FV (Force Voltage) is a proprietary evaluation metric not currently defined as an industry standard in the audio field. The detection algorithm combines multiple analysis layers in a complex configuration, and depending on the input signal characteristics or genre, unintended values may be displayed. Please treat the displayed values as reference only.
Technical inquiries regarding this application are accepted only from individuals with professional knowledge in audio engineering or acoustic signal processing, under their real name. We do not provide individual support for general usage questions. Thank you for your understanding.